
MANAGEMENT OVERVIEW
April 30, 2024
Balance Sheets
Receivables from Asset Management Estates, Net is $70.1 million; it is comprised of natural person credit unions and corporate credit unions.
Insurance and Guarantee Program Liabilities related to Reserves are $217.5 million; $7.3 million is for specific reserves for natural person credit unions, and $210.2 million is for general reserves.
Statements of Net Cost
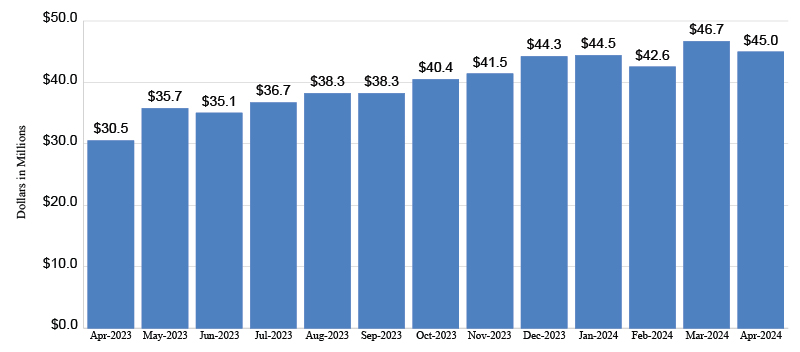
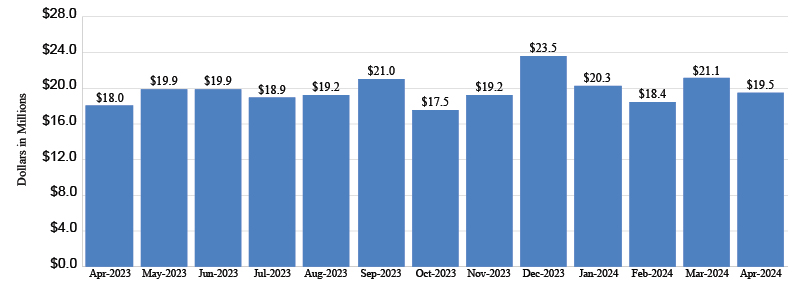
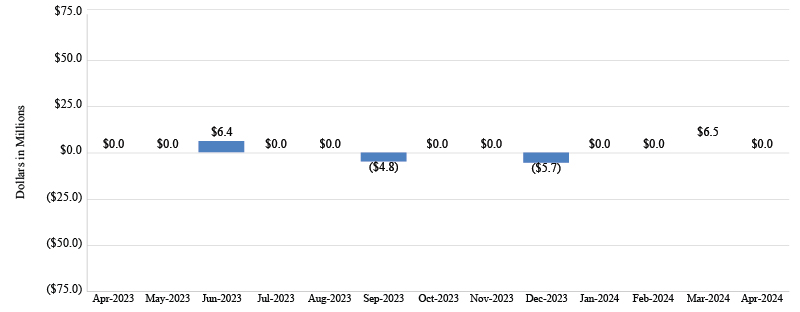
For the month ended April 30, 2024, the fund had a net income of $25.5 million. The fund recognized gross revenues of $45.0 million and total operating expenses of $19.5 million. The fund did not recognize any insurance loss expense during the month of April 2024.
BALANCE SHEETS
As of April 30, 2024 and 2023 (Dollars in Thousands)
ASSETS
| INTRAGOVERNMENTAL ASSETS | April 2024 | April 2023 |
|---|---|---|
| Fund Balance with Treasury | $28,469 | $26,628 |
| Investments, Net - U.S. Treasury Securities | 21,032,739 | 20,491,788 |
| Accrued Interest Receivable - Investments | 123,327 | 144,008 |
| Accounts Receivable - Due from the NCUA Operating Fund | 1,943 | 1,876 |
| Advances and Prepayments | 15,285 | 14,980 |
| Total Intragovernmental Assets | 21,201,763 | 20,679,280 |
| WITH THE PUBLIC ASSETS | April 2024 | April 2023 |
|---|---|---|
| Accounts Receivable - Due from Insured Credit Unions, Net | 2,918 | 1,411 |
| Advances and Prepayments | 1,067 | 886 |
| Receivables from Asset Management Estates (AMEs), Net* | 70,065 | 78,988 |
| Total with the Public Assets | 74,050 | 81,285 |
| TOTAL ASSETS | $21,275,813 | $20,760,565 |
LIABILITIES
| INTRAGOVERNMENTAL LIABILITIES | April 2024 | April 2023 |
|---|---|---|
| Accounts Payable - Due to the NCUA Operating Fund | 35 | 1 |
| Total Intragovernmental Liabilities | 35 | 1 |
| WITH THE PUBLIC LIABILITIES | April 2024 | April 2023 |
|---|---|---|
| Accounts Payable | 3,689 | 2,688 |
| Insurance and Guarantee Program Liabilities* | 217,513 | 197,983 |
| Other Liabilities | 47 | 624 |
| Total with the Public Liabilities | 221,249 | 201,295 |
| TOTAL LIABILITIES | $221,284 | $201,296 |
| NET POSITION | April 2024 | April 2023 |
|---|---|---|
| Cumulative Results of Operations | 3,845,591 | 3,700,982 |
| Contributed Capital | 17,208,938 | 16,858,287 |
| Total Net Position | 21,054,529 | 20,559,269 |
| TOTAL LIABILITIES AND NET POSITION | $21,275,813 | $20,760,565 |
* Receivable from AMEs, Net and Insurance and Guarantee Program Liabilities lines are generally updated quarterly.
STATEMENTS OF NET COST
For the periods ended April 30, 2024 and 2023 (Dollars in Thousands)
| GROSS COSTS | April 2024 | Year-to-Date April 2024 |
Year-to-Date April 2023 |
|---|---|---|---|
| Operating Expenses* | $19,473 | $79,218 | $75,189 |
| Provision for Insurance Losses | |||
| Reserve Expense (Reduction) | - | 8,114 | 12,240 |
| AME Receivable Bad Debt Expense | - | (2,212) | (20,425) |
| Total Provision for Insurance Losses | - | 5,902 | (8,185) |
| Other Losses | - | - | 9 |
| Total Gross Costs | 19,473 | 85,120 | 67,013 |
| LESS EXCHANGE REVENUES | April 2024 | Year-to-Date April 2024 |
Year-to-Date April 2023 |
|---|---|---|---|
| Other Revenue | (93) | (206) | (82) |
| Total Exchange Revenues | (93) | (206) | (82) |
| TOTAL NET COST/(INCOME) OF OPERATIONS | 19,380 | 84,914 | 66,931 |
| LESS NON-EXCHANGE REVENUES | April 2024 | Year-to-Date April 2024 |
Year-to-Date April 2023 |
|---|---|---|---|
| Interest Revenue - Investments | (44,876) | (178,490) | (121,368) |
| Total Non-Exchange Revenues | (44,876) | (178,490) | (121,368) |
| TOTAL NET COST/(INCOME) INCLUDING NON-EXCHANGE REVENUES | $(25,496) | $(93,576) | $(54,437) |
* National Credit Union Share Insurance Fund operating expenses are an allocation of total NCUA operating expenses, as determined by the overhead transfer rate set by the Board.
STATEMENTS OF CHANGES IN NET POSITION
For the periods ended April 30, 2024 and 2023 (Dollars in Thousands)
| CUMULATIVE RESULTS OF OPERATIONS | April 2024 | April 2023 |
|---|---|---|
| Beginning Balances | $3,966,687 | $3,258,998 |
| Non-Exchange Revenue | April 2024 | April 2023 |
|---|---|---|
| Interest Revenue - Investments | 178,490 | 121,368 |
| Net Unrealized Gain/(Loss) - Investments | (214,672) | 387,547 |
| Net Income /(Cost) of Operations | (84,914) | (66,931) |
| Change in Cumulative Results of Operations | 121,096 | 441,984 |
| CUMULATIVE RESULTS OF OPERATIONS | 3,845,591 | 3,700,982 |
| CONTRIBUTED CAPITAL | April 2024 | April 2023 |
|---|---|---|
| Beginning Balances | $17,234,861 | $16,916,436 |
| Change in Contributed Capital | (25,923) | (58,149) |
| CONTRIBUTED CAPITAL | 17,208,938 | 16,858,287 |
| NET POSITION | $21,054,529 | $20,559,269 |
| NET POSITION BREAKDOWN | April 2024 | April 2023 |
|---|---|---|
| Credit Union Contributed Capital | $17,208,938 | $16,858,287 |
| Retained Earnings | 5,227,561 | 4,978,710 |
| Total Net Position Without Unrealized Gain/ (Loss) | 22,436,499 | 21,836,997 |
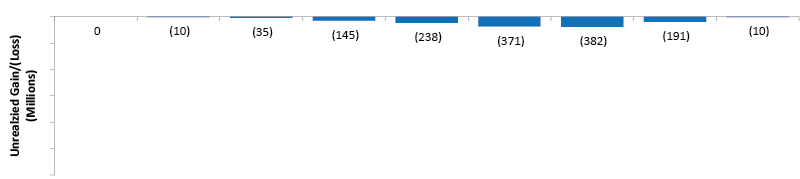
| Unrealized Gain/ (Loss) - Investments | (1,381,970) | (1,277,728) |
| NET POSITION | $21,054,529 | $20,559,269 |
Gross Income
April 2023 - April 2024
Operating Expenses
April 2023 - April 2024
Insurance Loss Expense (Reduction)
April 2023 - April 2024
INVESTMENT PORTFOLIO ACTIVITY
April 30, 2024
| I. INVESTMENT PORTFOLIO BALANCE AND MARKET VALUE (In Dollars) | Book Value | Market Value | Unrealized Gain or (Loss) | % Market to Book Value | Weighted Average Yield |
|---|---|---|---|---|---|
| Daily Treasury Account | $5,593,833,000 | 5,593,833,000 | - | 100.00% | 5.38% |
| U.S. Treasury Notes | 16,820,876,289 | 15,438,905,920 | (1,381,970,369) | 91.78% | 1.44% |
| Total | $22,414,709,289 | $21,032,738,920 | $(1,381,970,369) | 93.83% | 2.42% |
| II. INVESTMENT PORTFOLIO SUMMARY | Last Month | Current Month | CY To Date |
|---|---|---|---|
| Investment Yield | 2.43% | 2.42% | 2.40% |
| Investment Income | $46,621,159 | $44,876,398 | $178,489,562 |
| Weighted Avg. Maturity in Days / (Years) | 812 (2.22) | 790 (2.16) | - |
III. MONTHLY ACTIVITY FOR T-NOTES
| Purchased | Amount | Maturity | Yield |
|---|---|---|---|
| None | - | - | - |
| Maturity | Amount | Purchased | Yield |
|---|---|---|---|
| None | - | - | - |
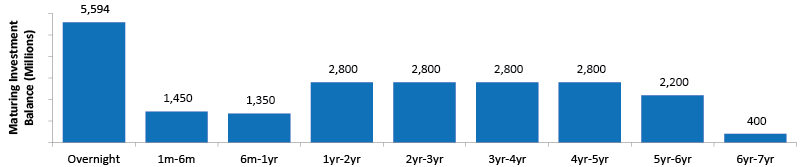
IV. MATURITY SCHEDULE (par value in millions)
TOTAL PAR VALUE - $ 22,194
TOTAL UNREALIZED GAIN/(LOSS) - $ (1,382)
The balances in the statement above are preliminary and unaudited.
The information provided in the portfolio summary above is preliminary and unaudited.